Index of Industrial Production (IIP): Understanding India’s Industrial Growth Indicator
Why is it in News?
India’s industrial output, measured through the Index of Industrial Production (IIP), grew by 4.9% in April 2026 under a newly revised data series with 2022–23 as the base year.
Although industrial production continued to expand, the growth rate was lower than the 5.8% recorded in April 2025 under the previous 2011–12 base year series. The latest data indicates a moderation in industrial activity even as the government has expanded the coverage of industries and updated the methodology to better reflect the current structure of the Indian economy.
For UPSC aspirants, the IIP is an important topic under Indian Economy, Growth and Development, Industrial Policy, and Economic Indicators.
What is the Index of Industrial Production (IIP)?
The Index of Industrial Production (IIP) is a key economic indicator that measures the short-term changes in the volume of production across various industrial sectors of the economy.
It helps policymakers, investors, businesses, and economists assess the overall health and performance of India’s industrial sector.
In simple terms, the IIP tells us whether industrial production is increasing or decreasing compared to a chosen base year.
Why is IIP Important?
The IIP serves as one of the most important indicators of economic activity because industries contribute significantly to:
- Economic growth
- Employment generation
- Infrastructure development
- Manufacturing expansion
- Investment trends
A rising IIP generally indicates economic expansion, while a falling IIP may signal a slowdown in industrial activity.
Who Compiles the IIP?
The Index of Industrial Production is compiled and published by:
National Statistical Office (NSO)
under the:
Ministry of Statistics and Programme Implementation (MoSPI)
Frequency of Release
The IIP is released:
Every Month
Usually with a lag of approximately six weeks.
This makes it one of the earliest indicators available for assessing economic performance.
Recent Revision of IIP
India periodically revises the IIP to ensure it reflects changes in the economy.
New Base Year
The base year has been updated from:
2011–12 → 2022–23
This is the:
10th Revision of IIP
since its introduction.
Why Was the Base Year Changed?
Over time, the structure of the economy changes.
New industries emerge while some products become obsolete.
The revision helps:
- Include emerging sectors.
- Remove outdated products.
- Improve data accuracy.
- Reflect modern industrial patterns.
- Capture structural changes in the economy.
National Industrial Classification (NIC) 2025
The revised IIP is aligned with:
National Industrial Classification (NIC) 2025
This updated framework classifies industries according to current economic activities and production structures.
Sectoral Composition of the New IIP Series
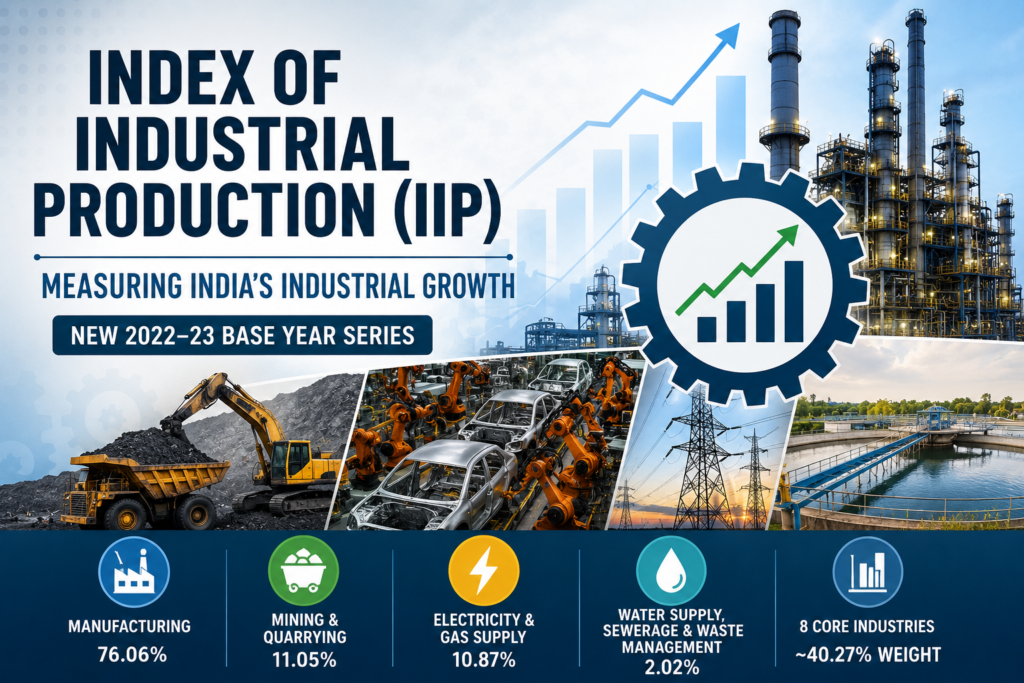
Under the revised 2022–23 base year, industrial production is divided into four major sectors.
1. Manufacturing
Weight: 76.06%
Manufacturing remains the largest component of the IIP.
It includes:
- Consumer goods
- Machinery
- Automobiles
- Electronics
- Industrial products
Manufacturing continues to be the primary driver of industrial growth.
2. Mining and Quarrying
Weight: 11.05%
This sector includes:
- Coal mining
- Iron ore extraction
- Crude oil production
- Natural gas extraction
- Mineral production
Mining provides essential raw materials for industries.
3. Electricity and Gas Supply
Weight: 10.87%
This sector covers:
- Electricity generation
- Transmission
- Distribution
- Gas supply systems
The revised series also captures renewable energy trends more effectively.
4. Water Supply, Sewerage and Waste Management
Weight: 2.02%
This is a newly introduced broad category.
It includes:
- Water treatment
- Water distribution
- Sewerage systems
- Waste collection
- Recycling services
Its inclusion reflects the growing importance of urban infrastructure and public utilities.
Use-Based Classification of IIP
Apart from sectoral classification, the IIP also categorizes industrial output according to the end-use of products.
Primary Goods
These are basic raw materials used in further production.
Examples
- Coal
- Crude oil
- Iron ore
Capital Goods
These are machinery and equipment used to produce other goods.
Examples
- Industrial machinery
- Manufacturing equipment
- Heavy engineering products
Capital goods growth often indicates future investment activity.
Intermediate Goods
These are semi-finished products used as inputs in manufacturing.
Examples
- Electronic components
- Industrial chemicals
- Processed metals
Infrastructure and Construction Goods
These support infrastructure development.
Examples
- Cement
- Steel rods
- Construction materials
Growth in this category reflects investment in infrastructure projects.
Consumer Durables
These are long-lasting consumer products.
Examples
- Automobiles
- Refrigerators
- Air conditioners
- Washing machines
Strong growth often indicates rising consumer confidence.
Consumer Non-Durables
These are products consumed quickly.
Examples
- Food products
- Medicines
- Personal care products
- FMCGs
This category reflects everyday consumption patterns.
Eight Core Industries
The IIP is heavily influenced by eight key infrastructure industries known as the:
Core Industries
Together, they account for approximately:
40.27% of Total IIP Weight
Because these sectors supply critical inputs to other industries, they are often considered the backbone of industrial growth.
The Eight Core Industries
1. Refinery Products
Highest weight in the revised series.
2. Electricity
A key driver of industrial activity.
3. Steel
Essential for manufacturing and construction.
4. Coal
Major energy source.
5. Crude Oil
Supports petroleum production.
6. Natural Gas
Important industrial fuel.
7. Cement
Crucial for infrastructure development.
8. Fertilisers
Lowest weight among core industries.
Supports agricultural productivity.
Why Are Core Industries Important?
Core industries influence:
- Manufacturing output
- Infrastructure development
- Construction activity
- Energy availability
A slowdown in these sectors often affects overall industrial growth.
What Does the Latest IIP Data Show?
April 2026 Growth Rate
4.9%
Comparison with Previous Years
| Year | Growth Rate |
|---|---|
| April 2023 | -0.1% |
| April 2024 | 7.3% |
| April 2025 | 5.8% |
| April 2026 | 4.9% |
The latest figures suggest that industrial production is growing but at a slower pace than in recent years.
Reasons Behind Slower Industrial Growth
Several factors may contribute to the moderation in industrial growth:
Global Economic Uncertainty
Weak international demand can affect exports and industrial production.
Slower Manufacturing Momentum
A slowdown in manufacturing growth directly affects IIP because of its large weightage.
Higher Input Costs
Industries may face pressure from energy and raw material costs.
Demand Moderation
Slower consumer spending can reduce industrial output.
Significance of the Revised IIP Series
The updated series offers a more realistic picture of India’s industrial economy.
Advantages
- Better sectoral representation.
- Inclusion of emerging industries.
- Improved policy planning.
- More accurate industrial measurement.
- Enhanced international comparability.
Challenges Associated with IIP
Limited Coverage
It mainly focuses on organized industrial activity.
Data Revision
Initial estimates are often revised later.
Short-Term Indicator
IIP reflects short-term industrial performance and should be interpreted alongside other economic indicators.
Way Forward
To sustain industrial growth, India should focus on:
Strengthening Manufacturing
Enhancing competitiveness and productivity.
Expanding Infrastructure
Boosting construction and investment activities.
Encouraging Private Investment
Supporting capital formation.
Promoting Innovation
Adopting advanced technologies and Industry 4.0 practices.
Improving Ease of Doing Business
Creating a favourable environment for industries.
UPSC Prelims Focus
Important Facts
| Feature | Details |
|---|---|
| Compiling Agency | NSO |
| Ministry | MoSPI |
| Latest Base Year | 2022–23 |
| Release Frequency | Monthly |
| Largest Sector | Manufacturing |
| Major Core Sector | Refinery Products |
Previous Year Question (UPSC Mains 2017)
Q. Industrial growth rate has lagged behind the overall growth of GDP in the post-reform period. Give reasons. How far are the recent changes in Industrial Policy capable of increasing the industrial growth rate?
Previous Year Question (UPSC Prelims 2015)
Q. In the Index of Eight Core Industries, which sector was given the highest weight?
(a) Coal Production
(b) Electricity Generation
(c) Fertilizer Production
(d) Electricity Generation
Correct Answer: (d)
Exam Keywords
- Index of Industrial Production (IIP)
- Industrial Growth
- NSO
- MoSPI
- Core Industries
- Manufacturing Sector
- Base Year Revision
- Industrial Policy
- Capital Goods
- Consumer Durables
- Infrastructure Goods
- Economic Indicators
- Industrial Output
- National Industrial Classification (NIC)
UPSC Syllabus Reference
GS Paper III – Indian Economy, Industrial Growth, Infrastructure, Economic Development, Government Policies and Economic Indicators.